Depth of Investigation (DOI)
The depth of investigation (DOI) describes how deeply an EM system can sense into the subsurface. It depends on physical attenuation (skin depth), transmitter–receiver geometry, and the electrical properties of the ground.
This interactive module demonstrates how classical skin‑depth attenuation and survey geometry jointly control the practical depth of investigation (DOI) in near‑surface electromagnetic (EM) methods. Users can vary geometry (transmitter–receiver spacing, sensor height) and material parameters (conductivity, magnetic permeability) to see how field amplitude decays with depth and where it intersects the instrument noise floor. The tool highlights how geometry can extend sensitivity but cannot overcome conductive attenuation governed by the skin‑depth relation. Parameter ranges, modeling assumptions, and a simple sensitivity analysis are included, with a clear path toward a frequency‑domain extension (amplitude and phase).
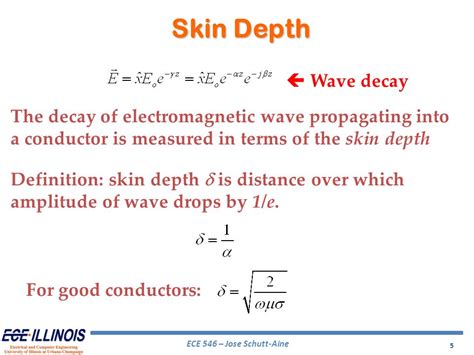
Skin‑depth attenuation in a conductive medium. The field amplitude decreases exponentially with depth.
What Controls the Depth of Investigation?
In electromagnetic methods, the depth of investigation (DOI) describes how deeply the system can sense into the subsurface. Even before considering frequency, the DOI is fundamentally limited by attenuation of the EM field as it diffuses into the ground.
The key physical control is the skin depth, which describes how quickly the field amplitude decays:
Skin Depth and DOI
Skin depth: \( \delta = \sqrt{\frac{2}{\omega \mu \sigma}} \)
Amplitude decay: \( A(z) = A_0 e^{-z / \delta} \)
Noise: The threshold relative amplitude \( A(z)/A_0 \) below which the signal becomes indistinguishable from noise and is no longer detectable.
Depth of Investigation (DOI): \( z_{\text{DOI}} = - \delta \ln(\text{noise}) \)
Noise vs DOI multiplier
| Noise | −ln(noise) | DOI / δ |
|---|---|---|
| 0.01 | 4.6 | 4.6 δ |
| 0.001 | 6.9 | 6.9 δ |
| 0.0001 | 9.2 | 9.2 δ |
| 0.00001 | 11.5 | 11.5 δ |
Analogy
Skin depth is like fog density — it tells you how quickly visibility drops. DOI is how far you can see before everything disappears. The fog didn’t change — your detection threshold did.
A depth of one skin depth (δ) corresponds to a reduction of the EM field to about 37% of its surface value. Two skin depths reduce it to ~14%, and so on. This exponential decay sets a natural limit on how deeply the system can “see.”
Geometry and System Design
Even in non‑frequency‑domain scenarios, the transmitter–receiver spacing plays a major role in DOI. A larger spacing increases sensitivity to deeper currents, while a very small spacing restricts the system to shallow responses.
However, geometry cannot overcome the fundamental attenuation imposed by the ground’s conductivity. Even with a large spacing, highly conductive ground will limit DOI.
Interactive Physics
Tip: Move the sliders to see how each parameter affects the depth of investigation.
This interactive model shows how spacing, conductivity, magnetic permeability, and noise control the skin depth and DOI
Model & Assumptions
- Homogeneous, isotropic half‑space; no lateral variations, no anisotropy, no induced polarization (IP).
- Quasi‑static EM approximation; displacement currents neglected.
- Field amplitude decays approximately following the classical skin‑depth relation.
- DOI is defined where the modeled signal amplitude falls below the user‑specified instrument noise floor.
- Geometry factor accounts for transmitter–receiver spacing and sensor height, implemented here as a simplified multiplicative term.
- Air–ground interface is flat; no cultural noise, no system‑specific calibration, and no coupling effects.
Parameters
- Spacing L: 1–50 m (handheld → boom → small airborne loops)
- Conductivity σ: 1e‑4–1 S/m (dry sand → clay/saline)
- Permeability μ/μ₀: 1–10 (nonmagnetic → magnetite‑rich soils)
- Sensor height h: 0–120 m (ground → airborne)
- Noise floor: 1e‑6–1e‑2 (relative amplitude)
Field Decay
Parameter Sensitivity
The depth of investigation depends on several parameters. The chart below shows which parameter currently has the strongest influence on DOI.
Note: A logarithmic scale is used so that small sensitivities remain visible without distorting the physics.
We compute finite‑difference sensitivities:
\[ S_x = \frac{\partial \text{DOI}}{\partial x} \approx \frac{\text{DOI}(x + \Delta x) - \text{DOI}(x)}{\Delta x} \]
Notes:• Spacing (L) affects DOI only indirectly because the current model uses a pure skin‑depth + noise formulation (no geometric coupling yet).
• Sensor height sensitivity is small because \( \partial DOI / \partial h = 1 \).
• Noise sensitivity is large because DOI depends on \( -\delta \ln(\text{noise}) \).
• A logarithmic scale is used to make small sensitivities visible without distorting the physics.
• Sensitivity units are in meters per unit of parameter (not percentages).
Depth of Investigation (DOI): The shaded red region represents depths where the received amplitude falls below the noise floor. In this zone:
- The instrument cannot reliably detect the signal
- The subsurface response is dominated by noise
- Inversion results would be unstable or non‑unique
- The DOI marks the boundary between usable and unusable depth
Summary & Interpretation
The depth of investigation (DOI) in time‑domain EM emerges from the balance between physical attenuation and measurement limitations. Skin depth governs how rapidly the electromagnetic field decays with depth, while the noise floor defines the smallest detectable amplitude. Together, these determine the practical limit beyond which the subsurface response becomes indistinguishable from noise.
The interactive model illustrates several key behaviors:
- Conductivity and permeability directly modify the skin depth, making them primary controls on DOI.
- Noise exerts a disproportionately strong influence because DOI depends logarithmically on the noise threshold.
- Sensor height shifts the DOI by a fixed amount, reflecting its linear contribution.
- Spacing affects geometric coupling but does not directly enter the simplified DOI expression; its influence becomes more pronounced when geometric attenuation is included.
These relationships show that DOI is not a fixed property of the Earth, but a dynamic quantity shaped by survey design, instrument performance, and subsurface physical properties. Understanding these dependencies is essential for interpreting EM data responsibly and for designing surveys that target specific depth ranges.
Limitations of the Simplified Model
The expressions used in this module capture the essential physics of attenuation but omit several important factors that influence DOI in real surveys:
- Geometric attenuation — dipole–dipole and loop–loop coupling introduce distance‑dependent decay not captured by pure skin‑depth attenuation.
- Waveform frequency content — the effective skin depth depends on the dominant frequencies present in the transmitter pulse.
- Receiver bandwidth and filtering — instrument response shapes the detectable signal envelope and influences the noise threshold.
- Layered Earth effects — conductivity contrasts, anisotropy, and stratigraphy modify the decay curve and shift the DOI.
- Inversion‑dependent DOI — in practice, DOI is influenced by model regularization, data coverage, and inversion constraints.
This simplified model is therefore best viewed as a conceptual tool — a way to build intuition about how physical parameters influence detectability — rather than a substitute for full forward modeling or inversion.
Next Steps & Extensions
Several natural extensions build on this foundation:
- Include geometric coupling to make spacing sensitivity physically meaningful.
- Introduce layered Earth models to show how DOI varies with conductivity contrasts.
- Add instrument noise models (white noise, 1/f noise, receiver drift).
- Visualize amplitude decay curves to connect the math directly to the physics.
- Extend to the frequency domain where amplitude and phase provide richer constraints on subsurface structure.
To build on the concepts introduced here, the next module explores the frequency‑domain formulation of electromagnetic fields, where attenuation, phase shifts, and complex impedance offer deeper insight into subsurface conductivity structure.
Having explored DOI in the time domain, we now turn to the frequency‑domain formulation, where amplitude and phase provide deeper insight into subsurface conductivity.
Frequency‑Domain DOI
While the time‑domain formulation describes attenuation through skin depth and noise limits, the frequency domain provides a complementary view of subsurface conductivity. Amplitude and phase responses vary systematically with frequency, allowing deeper or shallower penetration depending on the chosen operating band.
The next module extends the concepts introduced here by exploring how frequency controls penetration depth, resolution, and sensitivity to subsurface structure.
Go to Frequency‑Domain DOI →