Phoenix Core Interpretation

A browser‑based demo showing how core images can be transformed into structured geological interpretation.

Demo Notice: This is a simplified prototype built for portfolio purposes. It uses lightweight browser‑based logic and is not a full geological or ML model.

Data sourced from the Denison Mines NI 43‑101 Technical Report (Wheeler River Project).

Launch Core Interpretation Demo →

Hydrogeological Units (Phoenix Deposit)

These units form the basis for the interpretation workflow demonstrated in the interactive tool.
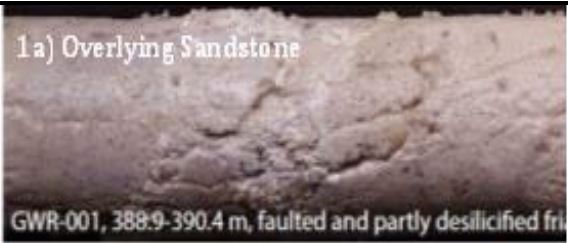
Unit 1a

Unit 1a

Overlying clean sandstone
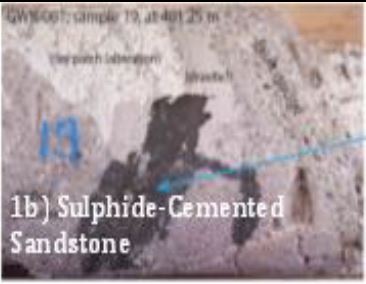
Unit 1b

Unit 1b

Sulphide‑cemented sandstone
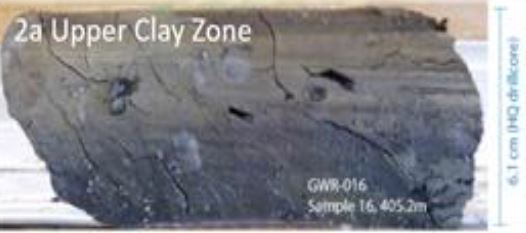
Unit 2a

Unit 2a

Upper clay‑altered zone

Unit 2b

Unit 2b

Friable high‑grade zone
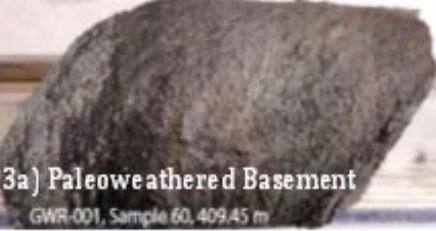
Unit 3a

Unit 3a

Paleoweathered basement
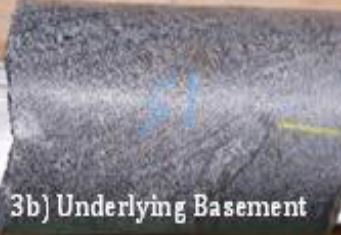
Unit 3b

Unit 3b

Underlying competent basement

The Phoenix deposit is a classic example of an unconformity‑related uranium system within the Athabasca Basin. The geological sequence transitions from clean sandstone into progressively stronger clay alteration near the unconformity, followed by friable high‑grade mineralized zones and finally into paleoweathered and competent basement rocks.

These changes in lithology and alteration reflect the interaction of oxidized basin fluids with reducing basement structures, creating the redox gradients and permeability pathways that control uranium deposition. The units shown above represent the key hydrogeological domains typically logged in Phoenix‑style systems and form the basis for the interpretation demonstrated in this project.

Sandstone Sequence (Units 1a–1b)

The upper sandstone units consist of clean to partially desilicified sandstone. Unit 1a is typically friable and may show fault‑related disruption. Unit 1b contains localized sulfide cementation, reflecting fluid movement through brittle structures prior to major mineralizing events.

Clay and Mineralized Zones (Units 2a–2e)

This interval marks the transition into the most hydrogeologically active part of the system. Unit 2a shows strong clay alteration and reduced competency. Unit 2b is the friable high‑grade zone, characterized by honeycomb textures, intense clay alteration, and high porosity. Unit 2c represents a brown oxidation boundary, while Unit 2d contains sulfide‑cemented patches indicating reducing conditions. Unit 2e forms the lower clay‑altered transition into basement rocks.

Basement Sequence (Units 3a–3b)

Unit 3a is a paleoweathered basement interval with softened textures and increased porosity, reflecting deep weathering prior to burial. Unit 3b marks the return to competent crystalline basement with minimal alteration. These units are critical for understanding structural preparation and the geometry of mineralizing fluids at the unconformity.

1. Image Acquisition & Pre‑Processing

  • Import raw core photos (JPG, PNG, or field images).
  • Standardize orientation and cropping to isolate the core box.
  • Normalize brightness and color to reduce lighting bias.
  • Apply optional filters to enhance textures such as clay alteration or friability.

2. Feature Identification

  • Detect color domains (e.g., red/brown oxidation, grey/green reduction).
  • Identify texture changes such as friable zones or honeycomb patterns.
  • Highlight structural features including faults, fractures, and broken core.
  • Locate high‑contrast mineral patches such as sulfides or hematite.

3. Unit Classification Logic

Each hydrogeological unit has diagnostic visual cues. A rule‑based or ML‑based classifier can suggest the most likely unit based on:

  • Color: oxidation vs. reduction signatures.
  • Texture: friability, clay content, or competency.
  • Structural context: faulted sandstone vs. intact basement.
  • Mineral indicators: sulfides, hematite, or clay alteration.

4. Interpretation Output

  • Suggested unit (1a, 2b, 3a, etc.).
  • Key visual indicators supporting the classification.
  • Confidence level (low/medium/high).
  • Optional: extracted features for ML training.

5. Reproducibility & Automation

  • Consistent logging across drillholes.
  • Automated pre‑screening of mineralized intervals.
  • Training datasets for machine‑learning models.
  • Rapid interpretation for exploration or QA workflows.

The geological concepts and unit definitions used in this demo are inspired by publicly available information from the Wheeler River Project (Denison Mines, 2018 Technical Report). All text on this page is original and rewritten for educational and portfolio purposes.

The workflow demonstrated here is broadly applicable across multiple industries:

  • Geophysics: image‑based attribute extraction, pattern recognition, and anomaly detection.
  • Drilling: interpretation of LWD image logs, boundary detection, and steering decisions.
  • Manufacturing: automated part‑number recognition, defect detection, and quality control.
  • Data Analytics: feature extraction pipelines, classification logic, and reproducible workflows.
Launch Core Interpretation Demo →