Data Analysis – Tools & Workflows
I build practical automation tools that streamline workflows, improve data quality, and reduce manual effort. My work spans Python scripting, analytics automation, JavaScript bookmarklets, local APIs, and dashboard development.
Areas of Focus
- Python automation for QA and engineering workflows
- Python for exploration data analysis
- Local APIs for data retrieval and integration
- JavaScript bookmarklets for UI automation
- Power BI dashboards and data pipelines
| Layer | Role | Process |
|---|---|---|
| Front-End (User) | User Interface | The user interacts with the Web App or Power BI. When more details are needed, the user triggers the workflow (e.g., by clicking a bookmarklet or a button). |
| Automation Layer (JS + Local API) | Workflow Trigger & Data Transfer | JavaScript bookmarklets autofill fields or extract key information from the Web App. The Web App sends this key to the Local API, which activates the Python script. |
| Back-End (Python + Databases) | Data Processing | Python queries multiple internal databases, extracts relevant details, and returns a structured JSON or HTML report to the API. |
| Front-End (Result) | Display | The Web App displays the results instantly in a popup window or a detailed HTML page. The entire workflow runs in seconds. |
Workflow Diagram: Data, Power BI & Python Integration
This diagram summarizes the table above and provides context for the videos shown below.
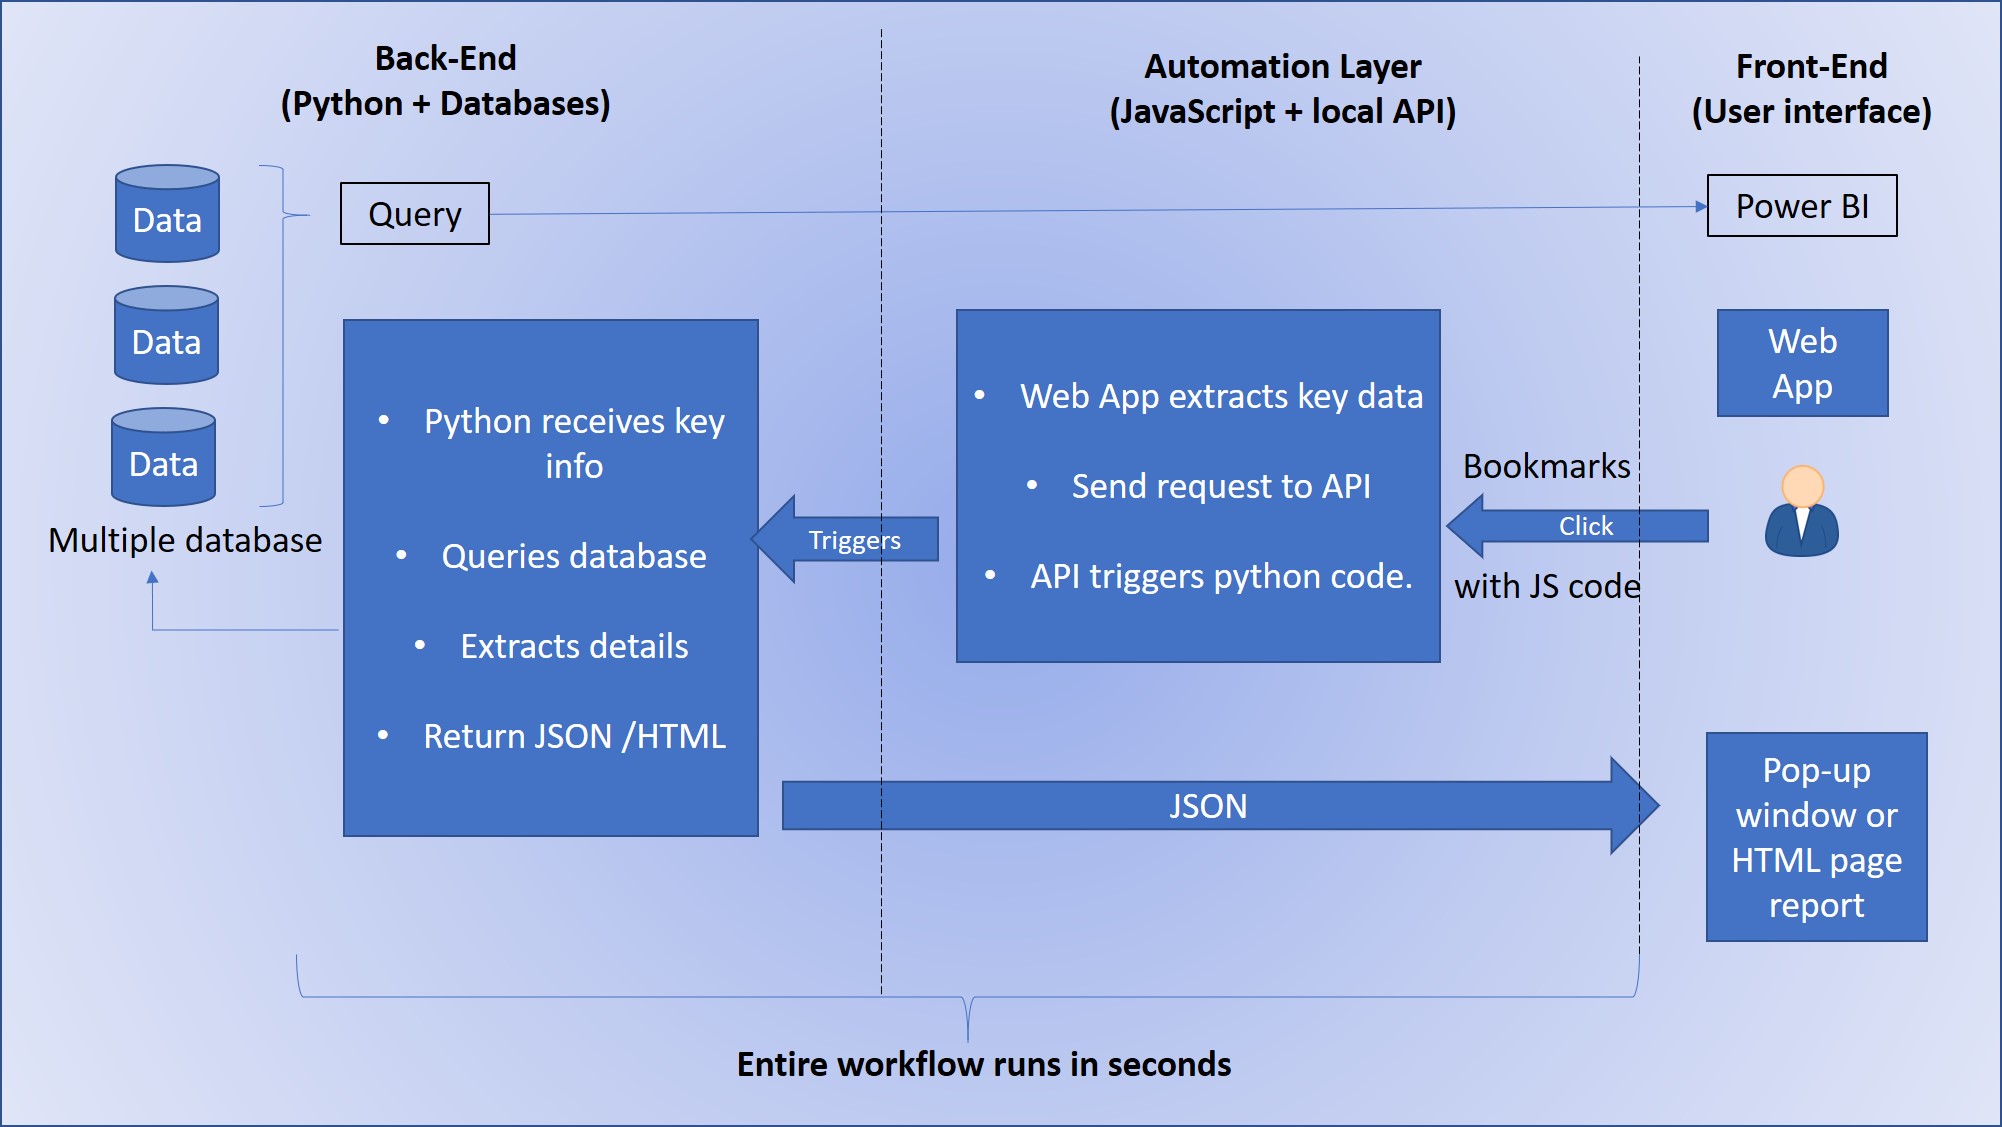
I created this diagram to visually explain the logic behind the workflow demonstrated in the videos below.
1. Power BI Dashboard
In my quality work, I focused on a data‑driven approach to explore root causes and improve decision‑making. Many available data sources were not connected, so I integrated them, built relationships, and created visual dashboards to reveal patterns and operational insights. This analytical mindset can be applied across sectors such as geoscience, engineering, and other technical fields. Through this process, I taught myself Power BI and developed practical skills in data modeling, visualization, and workflow automation.
This video shows one example from a larger set of Power BI dashboards I developed (over 15 pages in total) to analyze operational and quality data. Sensitive information has been blurred to ensure confidentiality.
2. Automation with JavaScript, Python & Local API
The following examples illustrate how I combine JavaScript, Python, and local APIs to automate workflows, retrieve data across systems, and generate structured reports directly from a web application.
2.1 JavaScript Bookmarklets for Autofill
Demonstration of custom JavaScript bookmarklets I created to automate repetitive data entry tasks. This solution was necessary because no existing extension met the requirements and several tools conflicted with IT security policies. Sensitive information has been blurred to ensure confidentiality.
2.2 Python + Local API → Popup Window
Example of a local API built with Python to retrieve information from an external database using data extracted from the web application. The results are displayed in a custom popup window for quick review. Sensitive information has been blurred to ensure confidentiality.
2.3 Python + API → Full Report (HTML or popup)
Full workflow demonstration: the web application sends data to a local Python API, which queries another database, processes the results, and generates a structured report (HTML or popup). This system significantly improved efficiency and reduced manual lookup time. Sensitive information has been blurred to ensure confidentiality.